Monday, March 22, 2021

Weekly Pulse Newsletter

Get the latest Pulse Survey releases. Stay up to date with COVID-19 data and Business Formation Statistics.
Registered United States Census Bureau Logo

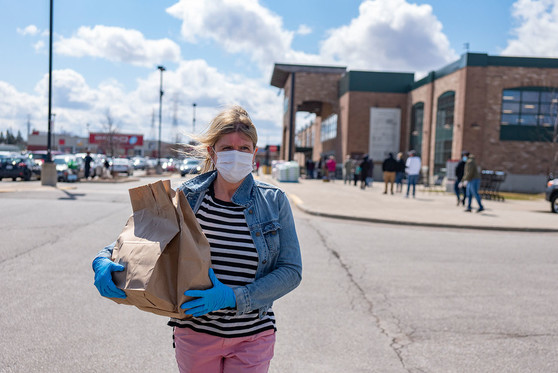
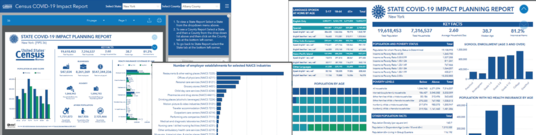
Weekly Pulse Newsletter

The U.S. Census Bureau is in a unique position to produce data on the social and economic effects of COVID-19 on American households and small businesses. 

Small Business Pulse Survey Updates

A retail worker wearing a face mask holds up a sign to indicate that her clothing store is open during the COVID-19 pandemic.

Explore Data

See Data Tables

Based on responses collected March 8 through March 14, the Small Business Pulse Survey estimates that:

  • 10.1% of U.S. small businesses experienced an increase in operating revenues/sales/receipts in the last week. For responses collected 3/1 – 3/7, this statistic was 8.6%

A graph showing if businesses had a change in operating revenues/sales/receipts in the past several weeks, not including financial assistance.
  • 7.7% of U.S. small businesses have experienced an increase in the total number of hours worked by paid employees in the last week. For responses collected 3/1-3/7, this statistic was 6.7%

A graph showing how businesses have had a change in the total number of hours worked by paid employees, over the past several weeks.
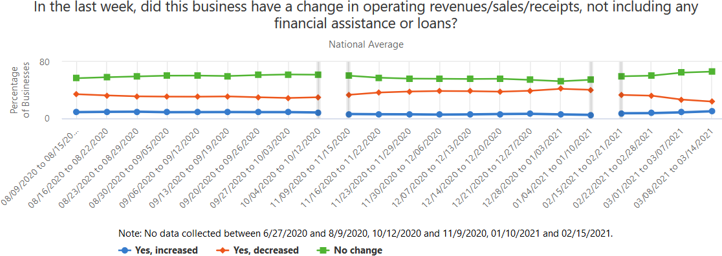
  • 7.1% of U.S. small businesses experienced an increase in the number of paid employees in the last week. For responses collected 3/1-3/7, this statistic was 6.1%

  • 18.0% of U.S. small businesses have received financial assistance from the Paycheck Protection Program (loan forgiveness) since December 27, 2020

  • 40.1% of U.S. small businesses believe more than 6 months will pass before their business returns to its normal level of operations. For responses collected 3/1-3/7, this statistic was 41.6%

  • 52.2% of U.S. educational services small businesses have experienced a large negative effect from the coronavirus pandemic

  • 12.4% of U.S. healthcare and social assistance small businesses required their employees to test negative for COVID-19 in the last week before coming to work

The Operational Challenges Index, which assesses the overall effect of the pandemic on business operations, has decreased challenges for the second week in a row, indicating an increasingly positive effect.
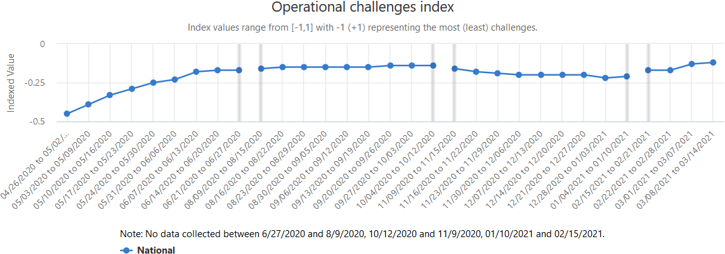
A graph showing the Operational Challenges Index, which assesses the overall effect of the pandemic on business operations.

Household Pulse Survey

A woman wearing a face mask as protection against COVID-19 walks back to her car with a bag of groceries.


Explore Data

See Data Tables

Results from the Household Pulse Survey are reported bi-weekly. The past week was an off week for the survey.

Help us spread the word about Census Bureau data. Share this story on social media or forward it to a friend.

Share This

Gray Divider

COVID-19 Data Hub and More Resources

New COVID-19 Data Hub Updates

The Census Bureau has launched a new tool — the COVID-19 Data Hub — designed to help guide the nation as it begins recovery efforts from the sweeping COVID-19 pandemic by providing economic and demographic data. Version 2.1 is now available!

Read More

Gray Divider

Business Formation Statistics Updates

The release of the February 2021 BFS data came out earlier this month! See the link below for data, graphs, and more.

Latest Updates

About the Data

About the Census Bureau

We serve as the nation's leading provider of quality data about its people and economy. The Census Bureau is the federal government's largest statistical agency. We are a scientific organization focused on data. Policy-makers, businesses, and the public use our information to make far-reaching decisions.

Subscribe to Receive Census Bureau Data Updates


This is an official email from the U.S. Census Bureau. If you have any questions or comments, please contact us (http://www.census.gov/about/contact-us.html).  

No comments:

Post a Comment