| |
| |
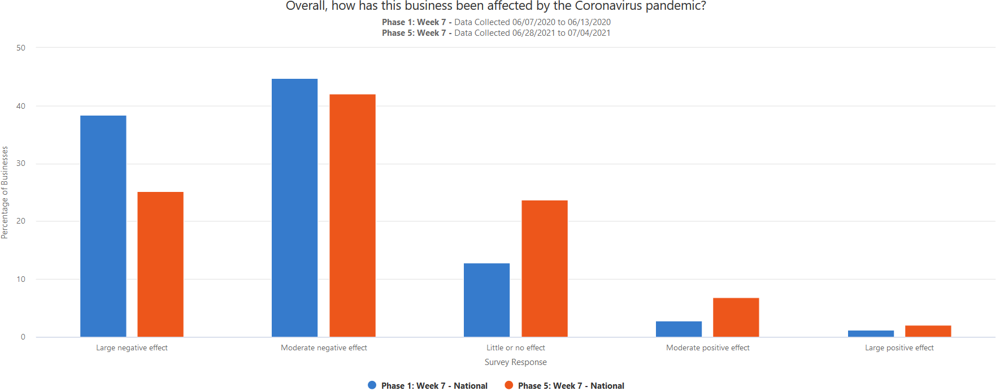
Weekly Pulse Newsletter The U.S. Census Bureau is in a unique position to produce data on the social and economic effects of COVID-19 on American households and small businesses.  Small Business Pulse Survey Updates See Data Tables Based on responses collected June 28 through July 4, the Small Business Pulse Survey estimates that: - 42.1% of U.S. small businesses report experiencing moderate negative impact from the Coronavirus pandemic. For responses collected 6/7/20 – 6/13/20, this statistic was 44.8%
 |
- 17.4% of U.S. small businesses report the need to identify new supply chain options in the next 6 months. For responses collected 6/21 – 6/27, this statistic was 18.0%
- 22.0% of U.S. small businesses report current operating capacity to be affected by availability of employees in the last week. For responses collected 6/21 – 6/27, this statistic was 21.5%
- 9.7% of U.S. small businesses report an increase in the number of paid employees in the last week. For responses collected 6/21 – 6/27, this statistic was 10.9%
- 10.8% of U.S. small businesses report an increase in the total number of hours worked by paid employees in the last week. For responses collected 6/21 – 6/27, this statistic was 11.8%
- 64.6% of U.S. manufacturing small businesses experienced domestic supplier delays in the last week
- 21.7% of U.S. Accommodation and Food Services small businesses report an increase in the number of paid employees in the last week
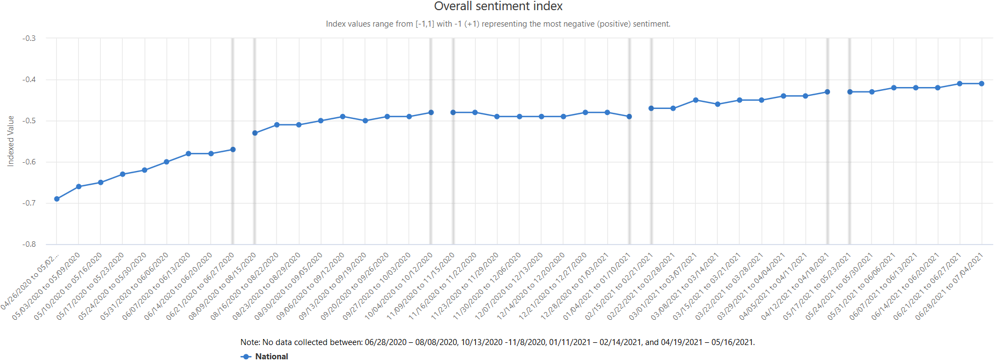
- The Overall Sentiment Index, which assesses the overall average effect of the coronavirus pandemic on businesses, remained at -0.41 from the prior week, indicating a similar sentiment for responses collected 6/28 – 7/4
 |
|
Household Pulse Survey See Data Tables Results are reported bi-weekly for the Household Pulse Survey; this is an off-week for reporting. Next week's results will be the last for Phase 3.1. Plans for the following phase are underway. |
| Help us spread the word about Census Bureau data. Share this story on social media or forward it to a friend.  COVID-19 Data Hub and More Resources The Census Bureau has launched a new tool — the COVID-19 Data Hub — designed to help guide the nation as it begins recovery efforts from the sweeping COVID-19 pandemic by providing economic and demographic data. Version 2.3 is now available! Business Formation Statistics Updates The release of the June 2021 BFS data will come out later this month. See link below for data, graphs, and more. About the Data |
About the Census Bureau We serve as the nation's leading provider of quality data about its people and economy. The Census Bureau is the federal government's largest statistical agency. We are a scientific organization focused on data. Policy-makers, businesses, and the public use our information to make far-reaching decisions. Subscribe to Receive Census Bureau Data Updates |


No comments:
Post a Comment