| |
| |
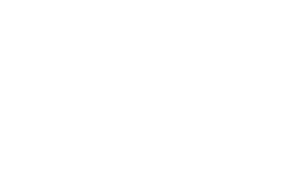
Weekly Pulse Newsletter The U.S. Census Bureau is in a unique position to produce data on the social and economic effects of COVID-19 on American households and small businesses.  Small Business Pulse Survey Updates See Data Tables Based on responses collected August 16 through August 22, the Small Business Pulse Survey estimates that: - 24.4% of U.S. small businesses report a decrease in revenues in the last week. For responses collected 7/12-7/18, this statistic was 20.3%
-
13.6% of U.S. small businesses experienced a decrease in the total number of hours worked by paid employees in the last week. For responses collected 7/12-7/18, this statistic was 10.3% -
9.1% of U.S. small businesses required employees to have proof of COVID-19 vaccination before coming to work in the last week. For responses collected 7/12-7/18, this statistic was 5.5% -
69.0% of U.S. accommodation and food services small businesses experienced difficulties hiring paid employees in the last week. The national average for this statistic was 34.7% 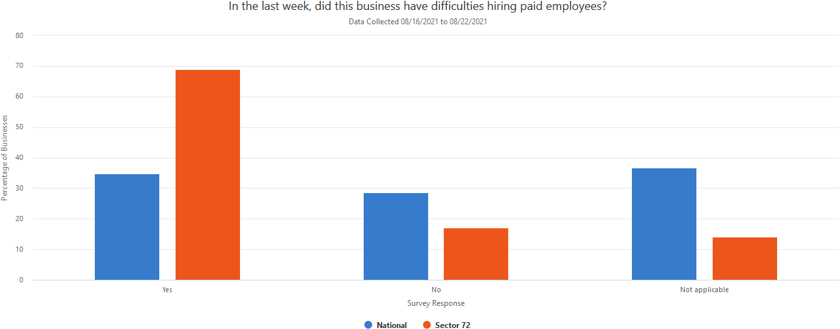 -
57.7% of U.S. construction small businesses are currently experiencing large increases in the prices they pay for goods and services compared to what was normal before March 13, 2020. The national average for this statistic is 29.2% -
23.9% of U.S. educational services small businesses are currently experiencing a large decrease in demand of their goods or services compared to what was normal before March 13, 2020. The national average for this statistic is 10.8% -
67.9% of U.S. manufacturing small businesses experienced domestic supplier delays in the last week. The national average for this statistic was 42.6% |
Household Pulse Survey See Data Tables Based on responses collected August 4 through August 16, the Household Pulse Survey estimates that: - Childcare Disruptions (for Kids 5 and Under): Of adults living in homes with children under 5, 30.3% were in homes where children were unable to attend daycare/other childcare arrangement because of safety concerns in the last 4 weeks
- Food Assistance for Children: Of adults living in households with children, 30.5% were in homes where children received food assistance in the last 7 days
- Worked Onsite at a Workplace: 58.8% of adults lived in households where someone worked onsite at a workplace in past 7 days
- Unable to Pay Energy Bill: 19.4% of adults lived in households that were unable to pay an energy bill in full in the last 12 months
- Child Tax Credit Spending: Of adults living in households that received a Child Tax Credit payment in past 4 weeks, 69% either mostly spent it or used it to pay down debt
- Children's Telehealth: Of adults living in homes with children, 15.2% were in homes where children had an appointment with a doctor, nurse, or other health professional by video or phone in the past 4 weeks
- Household Telehealth: 19.6% of adults had an appointment with a doctor, nurse, or other health professional by video or phone in the past 4 weeks
- Food Scarcity: 7.8% of adults lived in homes where there was sometimes or often not enough to eat in the past 7 days
- Housing Insecurity: 6.1% of adults aren't current on rent/mortgage payment and have slight/no confidence in making next payment on time
- Eviction or Foreclosure: Of adults living in households not current on rent/mortgage 32.8% report eviction or foreclosure in the next two months is somewhat or very likely
- Difficulty with Household Expenses: 26.7% of adults live in households where it has been somewhat or very difficult to pay usual household expenses in the past 7 days
- Sexual Orientation and Gender Identity (SOGI): The proportion of adults responding as Lesbian, Gay, Bisexual and Transgender (LGBT) who reported that they sometimes or often did not have enough food in the last 7 days was 13%, compared with 7% of those responding as not LGBT
- The proportion of adults responding as LGBT who reported that they or someone in their household experienced a loss of employment income in the last 4-weeks was 21%, compared with 15% of those responding as not LGBT
|
| Help us spread the word about Census Bureau data. Share this story on social media or forward it to a friend.  COVID-19 Data Hub and More Resources The Census Bureau has launched a new tool — the COVID-19 Data Hub — designed to help guide the nation as it begins recovery efforts from the sweeping COVID-19 pandemic by providing economic and demographic data. Version 2.3 is now available! Business Formation Statistics Updates The release of the July 2021 BFS data came out earlier this month. See link below for data, graphs, and more. About the Data |
About the Census Bureau We serve as the nation's leading provider of quality data about its people and economy. The Census Bureau is the federal government's largest statistical agency. We are a scientific organization focused on data. Policy-makers, businesses, and the public use our information to make far-reaching decisions. Subscribe to Receive Census Bureau Data Updates |


No comments:
Post a Comment