Friday, September 3, 2021

Weekly Pulse Newsletter

Get the latest Pulse Survey releases. Stay up to date with COVID-19 data and Business Formation Statistics.
Registered United States Census Bureau Logo

Weekly Pulse Newsletter

The U.S. Census Bureau is in a unique position to produce data on the social and economic effects of COVID-19 on American households and small businesses. 

Small Business Pulse Survey Updates

A retail worker wearing a face mask holds up a sign to indicate that her clothing store is open during the COVID-19 pandemic.

Explore Data

See Data Tables

Based on responses collected August 23 through August 29, the Small Business Pulse Survey estimates that:

  • 33.6% of U.S. small businesses reported difficulties in hiring paid employees in the last week. For responses collected 8/16-8/22, this was 34.7%

A graph showing the percentage of businesses that have and have not had difficulties hiring paid employees, comparing the weeks of 8/16 and 8/23/2021.
  • 14.0% of U.S. small businesses experienced a decrease in the total number of hours worked by paid employees in the last week. For responses collected 8/16-8/22, this was 13.6%

  • 42.4% of U.S. small businesses experienced domestic supplier delays in the last week. For responses collected 8/16-8/22, this was 42.6%

  • 20.2% of U.S. Accommodation and Food Services small businesses experienced a decrease in the number of paid employees in the last week. The national average for this statistic was 12.3%

A graph showing what percentage of businesses had a change in the number of paid employees in the last week.
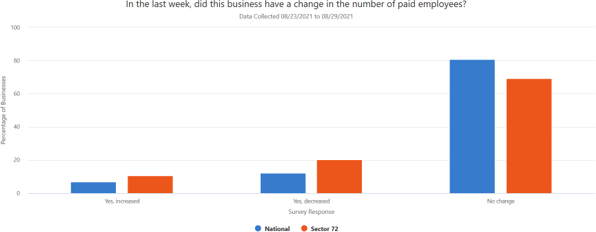
  • 47.5% of U.S. Manufacturing small businesses are currently experiencing large increases in the prices they pay for goods and services compared to what was normal before March 13, 2020. The national average is 29.4%

  • 18.3% of U.S. Arts Entertainment Recreation small businesses are currently experiencing a large decrease in demand of their goods or services compared to what was normal before March 13, 2020. The national average is 10.3%

  • 15.8% of U.S. Health Care and Social Assistance small businesses required employees to have proof of COVID-19 vaccination before physically coming to work in the last week. The national average was 9.3%

Household Pulse Survey

A woman wearing a face mask as protection against COVID-19 walks back to her car with a bag of groceries.


Explore Data

See Data Tables

Responses for the Household Pulse Survey are reported biweekly; this is an off week for the survey.

Help us spread the word about Census Bureau data. Share this story on social media or forward it to a friend.

Share This

Gray Divider

COVID-19 Data Hub and More Resources

New COVID-19 Data Hub Updates

The Census Bureau has launched a new tool — the COVID-19 Data Hub — designed to help guide the nation as it begins recovery efforts from the sweeping COVID-19 pandemic by providing economic and demographic data. Version 2.4 is now available!

Read More

Gray Divider

Business Formation Statistics Updates

The release of the August 2021 BFS data will come out later this month. See link below for data, graphs, and more.

Latest Updates

About the Data

About the Census Bureau

We serve as the nation's leading provider of quality data about its people and economy. The Census Bureau is the federal government's largest statistical agency. We are a scientific organization focused on data. Policy-makers, businesses, and the public use our information to make far-reaching decisions.

Subscribe to Receive Census Bureau Data Updates


This is an official email from the U.S. Census Bureau. If you have any questions or comments, please contact us (http://www.census.gov/about/contact-us.html).  

No comments:

Post a Comment